 By vusta · 2015-09-04
Thought this may be useful so I'll share. This reads in a CSV or plain text file, comma delimited (data in 2nd column) and produces various types of graph for it. It does not predict when the next GFC will hit...
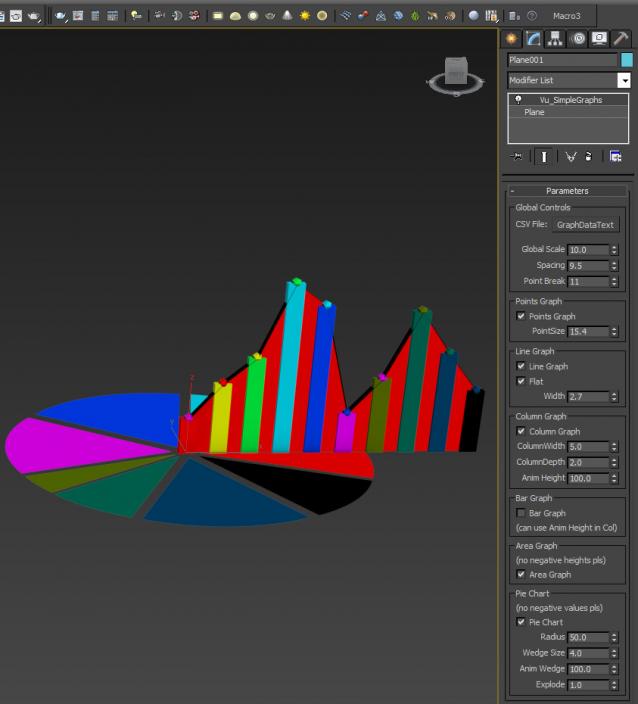
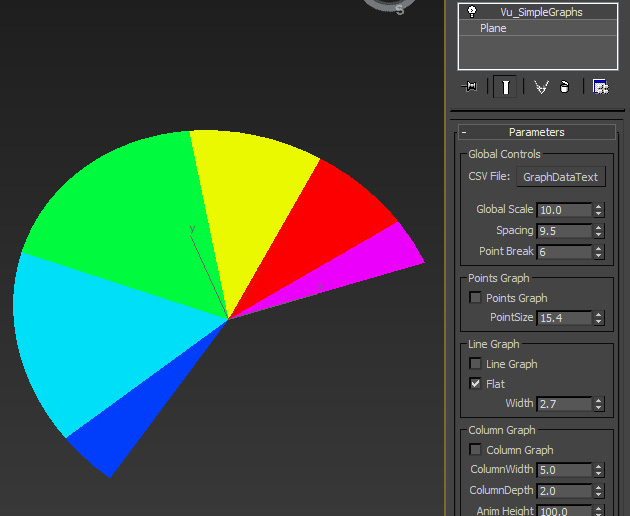
I forgot to record this in the video but you can animate the wedges of a pie chart with 'Point Break' too as below pic...
Please thank Swordslayer for writing the File Reader logic...I got no clue on this stuff.
The attached compound MatIDPerMesh simply assigns a MatID sequentially to your MeshArray, eg. Mesh 0 will have matID 1, Mesh 1 will have MatID 2...etc...Do not use CombineMeshes as it destroys the separate matIDs...see the graph for how I work around this...
MatIDPerMesh ver 1.01: fixed a little bug, the first MatID should be 1 not 2.
Ver 1.02.00: updated for EXT2, if you don't have EXT2, please do NOT use this latest version
Please note: you animate the Pie Chart using Point Break too !!! Just set it to 0, then dial up...